


#MolPrint3D: A #Blender add-on for enhanced #3Dprinting of ball-and-stick #molecular models:
https://doi.org/10.1021/acs.jchemed.7b00549
#DIYbio #chemistry #lab #CompChem #bioinformatics #visualization #MINT #STEM #EDU #school #Schule #education

Administered by:
#visualization
2 posts2 participants0 posts today

Plot a histogram from a table with calculated percentages:
https://www.draketo.de/software/org-mode-tipps#plot-historgram-table-calculation

www.draketo.deHow to do X with Emacs Org-ModeVerstreute Werke von ((λ()'Dr.ArneBab))

How can #stats communication impact high-stakes judgments?
1. Intelligence analysts often failed to assign their agency's recommended words such as "likely" or "remote chance" to numeric #probability.
2. #Visualization of the probabilities didn't help?

Added a customizable 2D vector field plot function for https://thi.ng/viz. Some example outputs attached, code examples forthcoming...

On-Demand Data Science Support for Researchers! 

Got valuable data but no time for deep analysis? 
The #SUNDDataLab at the UCPH Center for Health Data Science (#HeaDS) connects you with expert Data Scientists—on demand!
We offer help with #DataCleaning, #Visualization, #Stats, and #ReproducibleResearch.
 https://www.heads.ku.dk/datalab/
 datalab@sund.ku.dk

Microsoft Clarity introduces trends feature with line graphs: Visualization tool helps marketers track data changes over 30-day periods for improved analytics. https://ppc.land/microsoft-clarity-introduces-trends-feature-with-line-graphs/ #MicrosoftClarity #DataAnalytics #MarketingTools #Visualization #TrendsFeature
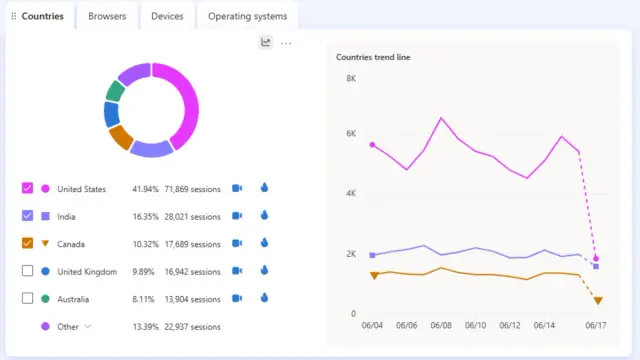
PPC Land · Microsoft Clarity introduces trends feature with line graphsVisualization tool helps marketers track data changes over 30-day periods for improved analytics.

I'm unsatisfied with easing functions - Dave Pagurek via @ndyg https://lobste.rs/s/qqm5uw #design #javascript #visualization #web
https://www.davepagurek.com/blog/easing-functions/
lobste.rsI'm unsatisfied with easing functions - Dave Pagurek | Lobsters

Algorithms for generating fantastically weird organic patterns.
Continued thread

With the interactive visualizations, you can do interesting bar charts, or a box plot. Hover each box and you get min/max, outliers, mean, median etc. make it horizontal, notched, change grouping by color, look at different variables #dataviz #analytics #visualization #chicago #wolves #ahl #carolina #hurricanes #prospects #nhl #sportsanalytics #hockey
JuliaScope: The Fractal Graphing Calculator https://lobste.rs/s/mfv2r6 #math #visualization
https://www.juliascope.com/
lobste.rsJuliaScope: The Fractal Graphing Calculator | Lobsters

Cope and Drag — CnD — Lightweight Diagraming Language wins awards
“CnD’s design is driven by cognitive science principles that influence spatial reasoning, visualization, and diagramming. It combines this with a bottom-up analysis that distills patterns from dozens of actual custom visualizations, and finds the two come together nicely. The resulting language is small, uses minimal notation, and can be used incrementally.”
#BrownPLT #diagraming #visualization #OSS
https://cs.brown.edu/news/2025/07/16/brown-university-programming-languages-team-receives-ecoops-distinguished-paper-and-distinguished-artifact-awards/
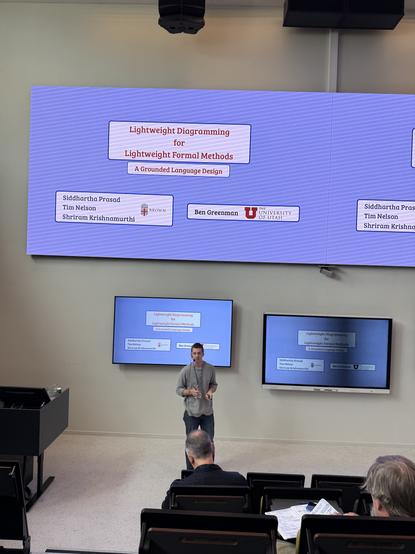
cs.brown.edu · Brown University Programming Languages Team Receives ECOOP’s Distinguished Paper And Distinguished Artifact AwardsNew work (Cope and Drag, also known as CnD) from Brown PLT is a novel lightweight diagramming language. It’s just earned recognition at ECOOP 2025, receiving both a Distinguished Paper and a Distinguished Artifact Award.


Ten years of running every day, visualized.
https://nodaysoff.run
@running #running #visualization

no days offno days offA celebration of consistency, discipline, and the pursuit of movement


Winners of the $10,000 ISBN visualization bounty (From February 2024)
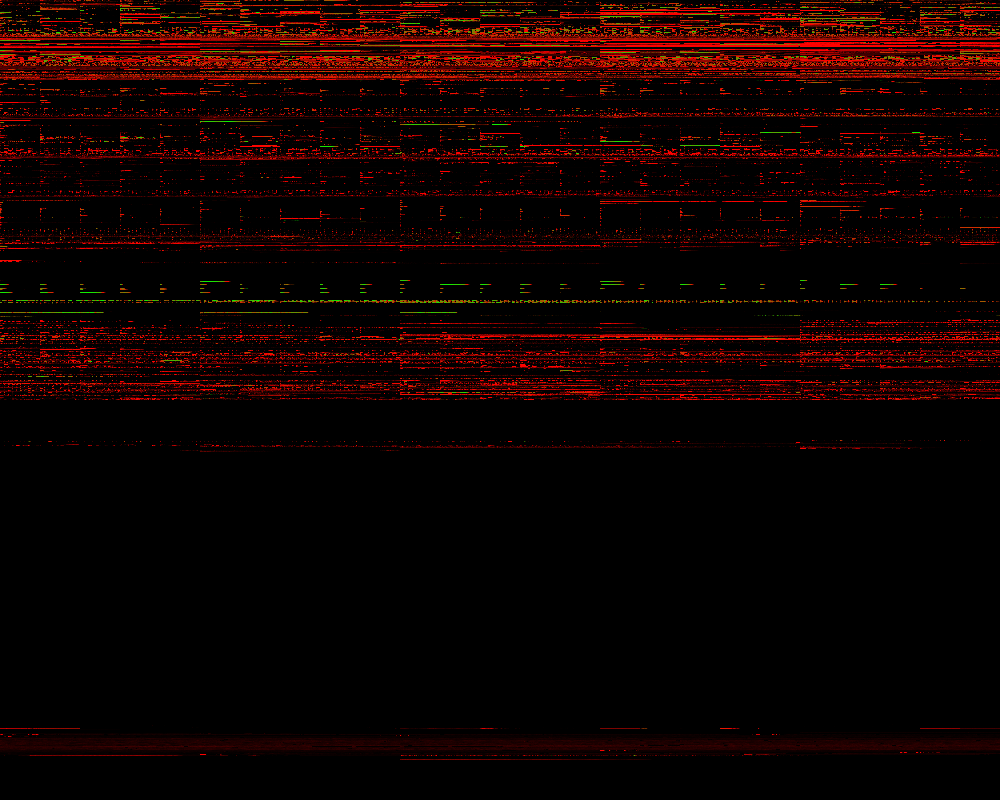
annas-archive.orgWinners of the ISBN visualization bountyWe got some incredible submissions to the $10,000 ISBN visualization bounty.
Ten years of running every day, visualized https://lobste.rs/s/9c5i3u #visualization
https://nodaysoff.run/
lobste.rsTen years of running every day, visualized | Lobsters

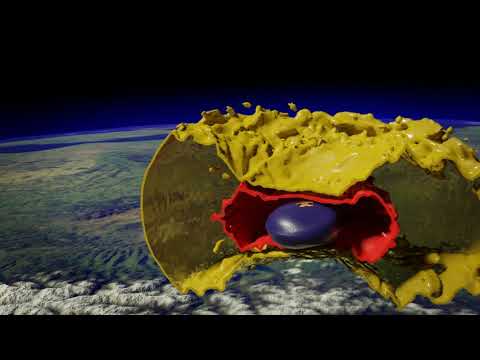
Neutron star merger visualized
https://www.youtube.com/watch?v=xIthgcx-axs
The scientific details are described in the publication: W. Kastaun and F. Ohme, “Numerical inside view of hypermassive remnant models for GW170817”, Phys. Rev. D 104 (2021), DOI: https://doi.org/10.1103/PhysRevD.104.023001
This is excellent visualization!
www.youtube.com- YouTubeEnjoy the videos and music you love, upload original content, and share it all with friends, family, and the world on YouTube.

Ten years of running every day, visualized
no days offno days offA celebration of consistency, discipline, and the pursuit of movement

Here's a powerful way to use visualization techniques to help meeting design clients figure out what they really want and need
https://www.conferencesthatwork.com/index.php/event-design/2018/07/help-meeting-design-clients
Algorithms for making interesting organic simulations https://lobste.rs/s/rx4vvq #graphics #visualization
https://bleuje.com/physarum-explanation/
lobste.rsAlgorithms for making interesting organic simulations | Lobsters


Dataviz Inspiration is a collection of useful chart examples when designing a new graph https://www.dataviz-inspiration.com/ #Visualization #Graph