


Apologies for the screenshot from bluesky, but The R-ladies of Melbourne account has shared this geom to add cats to ggplots, and I feel it would be a bit of crime to not share with you all..

Administered by:
#visualisation
2 posts2 participants0 posts today

tried the YT premiere feature for the first time.
Video goes live in 15 minutes:
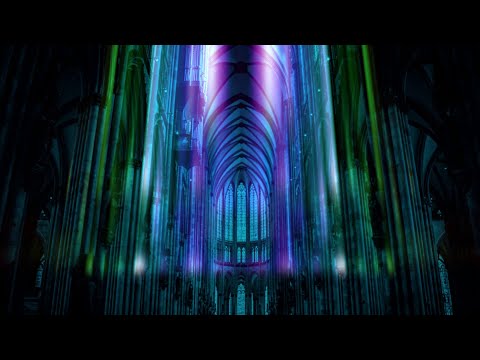
Working an several real time audio visualisations for Raspberry Pi with invisible touch interface in Pixilang.
Code is / will be open source of course.
Track is from 2022
youtu.be- YouTubeEnjoy the videos and music you love, upload original content, and share it all with friends, family, and the world on YouTube.

The ultimate key to transformation? Radical self-honesty. Change starts the moment you stop lying to yourself. 

https://de320.isrefer.com/go/CROWN963FREE/Stuartn/
#Transformation #SelfGrowth #InnerPower #ThinkandGrowEducation #RayBehan #Introspection #Visualisation

Exercice de visualisation d'information : Anna's archives, la bibliothèque numérique en ligne qui prétend être la plus grande collection ouverte de livres de tous les temps, a lancé un concours de programmation de différents outils de visualisation des ISBN de leur collection. On peut voir et essayer les projets finalistes ici :

Just a little bouncy balls visualisation in R:
```
n = 100
c = sample(rainbow(n))
x = runif(n)
y = runif(n)
vx = runif(n)/100
vy = runif(n)/100
while(1) {
ix = which(x<0 | x > 1)
iy = which(y<0 | y > 1)
vx[ix] = -vx[ix]
vy[iy] = -vy[iy]
x = x + vx
y = y + vy
plot(x,y, xlim=c(0,1), ylim=c(0,1),
pch=16, cex=2, col=c, ann=F, ax=F)
box()
dev.flush()
dev.hold()
Sys.sleep(.01)
}
```
#rstats #visualisation


GISCARTA’s New Interactive Web Map Dedicated To The Kiel Canal In Northern Germany
--
https://map.giscarta.com/viewer/9d883cca-93f0-4ad5-9b3d-7d87d6471204 <-- shared GISCARTA storymap
--
“ This detailed cartographic application offers a comprehensive spatial overview of the region’s maritime infrastructure, navigation environment, and key port connections between the North and Baltic Seas.
 With step-by-step storytelling, analytical widgets, and rich attribute tables enhanced by photographs, the project provides a powerful tool for analyzing maritime logistics, infrastructure, and safety along the canal.
 Explore the story, discover key features, and gain new insights into one of Europe’s most important waterways!...”
#GIS #spatial #mapping #webmap #storymap #GISCARTA #gis #dataviz #geo #map #geodata #geoprocessing #dashboards #geoanalytics #KielCanal #Kiel #accidents #monitoring #Germany #transportation #visualisation #usecase #logistics #shipping #cargo
#GISCARTA

The sky has personality today. It’s beautiful.
It looks like it remembers something.
Like it’s holding a version of you you’ve been trying to call home.
Still and calm. Heavy with magic.
Just waiting for you to look up and say, I’m ready.
I’ve just released a new guided activation - a journey into the forest, into your own remembering.
You’ll meet the version of you who never left.
You’ll feel what it’s like to become them.
Drop an emoji if you’re ready to meet the power that’s always lived inside you.
#feelgoodrebel #feelgoodrebelacademy #familiar #community #connection #meditation #visualisation #activation
It looks like it remembers something.
Like it’s holding a version of you you’ve been trying to call home.
Still and calm. Heavy with magic.
Just waiting for you to look up and say, I’m ready.
I’ve just released a new guided activation - a journey into the forest, into your own remembering.
You’ll meet the version of you who never left.
You’ll feel what it’s like to become them.
Drop an emoji if you’re ready to meet the power that’s always lived inside you.#feelgoodrebel #feelgoodrebelacademy #familiar #community #connection #meditation #visualisation #activation
I met a version of me I didn’t know I was allowed to become.He came to me in a meditation — this calm, unstoppable, wildly loving presence.
Part polar bear. Part Brazilian chill joy. Part pure, unshakable magic.
I call him Keanu. And he’s not just a guide. He’s me.
The part of me that doesn’t ask for permission.
That doesn’t shrink or apologise.
That just is… calm, powerful, and fiercely kind.
And the wildest thing is, that he was never separate from me. I just needed to remember.
Now, whenever I feel pulled out of myself, by fear, guilt, people-pleasing, I close my eyes, breathe, and become him again.
Or, just look at my new tattoo, because I felt so connected to him, I had to have it made!
I have begun walking through my day with his spine.
With his smile. With his sacred stillness.
This is what it means to return to your power.
To stop looking outside for safety.
To become the one you’ve been seeking all along.
 Want to meet your own version?
You might be surprised who shows up in the clearing.
Drop an emoji if you’re ready to remember what’s always lived inside you.#feelgoodrebel #feelgoodrebelacademy #rebelactivation #meditation #activation #visualisation #familiar #innerbeing #higherself
Awesome Strategies To Visualize Change With Time
--
https://medium.com/@yuanbo.faith/awesome-strategies-to-visualize-change-with-time-f8a7fa8362f2 <-- shared technical article
--
https://www.databrewer.co/R/gallery <-- shared further examples & background/processes
--
“This article summarizes effective strategies to visualize temporal changes, illustrated with inspiring graphic examples (with link to source code [and methods])…”
#GIS #spatial #mapping #datavisualisation #visualisation #R #code #methods #scripts #opensource #spatiotemporal #temporal #temporalchange #visualise #graphic #examples #opendata
Really interesting bigger picture talk on next generation of environmental exposure models by @samharrison7 at #SETAC #Vienna, from monitoring using #CitizenScience to #Modelling and #Visualisation including a #TheoryOfChange 
"It's important to engage with other disciplines"

j'ai joué dans ma première pièce de théâtre en 4e année (10 ans) parce que les Frères étaient certains que j'oublierais rien, incluant le dialogue de tous les autres personnages
je me suis rappelé un interview de Sir Lawrence Oliver qui m'avait enseigné quelques années plus tôt comment imiter les gens; je me suis inspiré du vendeur d'assurance de mes parents pour jouer le rôle d'un inspecteur d'impôts
les Frères sont tombés de leurs chaises!
RiverREM - Generating River Relative Elevation Model (REM) Visualisations
--
https://github.com/OpenTopography/RiverREM <-- shared GitHub repository
--
https://opentopography.github.io/RiverREM/ <-- shared documentation
--
https://opentopography.org/blog/new-package-automates-river-relative-elevation-model-rem-generation <-- shared Open Topography blog post about RiverREM
--
H/T Heidi Luchsinger / Open Topography
[this post should not be considered as an endorsement of this product aka caveat emptor]
#GIS #spatial #mapping #remotesensing #earthobservation #Python #LiDAR #RiverREM #visualisation #hydrology #water #river #rivervalley #floodplain #terraces #GitHub #opensource #opendata #DEM #REM #model #modeling #RiverRelativeModel #documentation #tutorial #learning #tool #elevation #raster #sinuosity #drainage
Replied in thread
@emchateau thanks for the hint to David J. Birnbaum's collection!
Funny coincidence, I am just on my way to what will surely be a wonderful and productive workshop on #Collation and #Visualisation (https://www.lorentzcenter.nl/seeing-the-difference-visualizing-textual-variation.html), and am reading (and can recommend) a #Balisage paper by said D. Birnbaum & Ronald Dekker in preparation: https://doi.org/10.4242/BalisageVol29.Birnbaum01
I will check out the #XSLT learning resources you mentioned and the ones other might still mention during the week, thanks again!
CC @petrichor

Consciousness and Visual Arts Study Visualisation using Obsidian + Infranodus, my second brain!
Workflow that helps visualise and connect thinking.
Public Side @ https://one.yoso.one/
Special thanks to
https://infranodus.com
https://obsidian.md


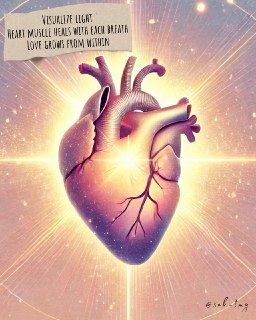
 Guided Visualization: A Pathway to Better Health
Join us for this podcast as we explore the science behind guided visualization and its impact on the brain and body.
In this episode:
- The science behind visualization for healing
- How visualization affects brain and body
- A guided heart healing meditation
 JOIN US LIVE: April 10th at 6:00 PM UTC
 Link to the show: https://t.me/TMGmeditations/566
TelegramTransformational Meditaton Group🧘♀️✨ The Healing Power of Guided Visualization ✨🧘♀️
Can you imagine your way to better health? Join us on Love Your Love Muscle podcast as we explore whether guided visualization actually works for healing!
In this episode:
The science behind visualization for healing
How visualization affects your brain and body
A soothing guided heart healing meditation you can try right now
🔴 JOIN US LIVE: April 10th at 6:00 PM UTC
🔗 Link to the show: https://t.me/TMGmeditations/566
#MeditationPodcast #GuidedVisualization #Healing #HeartHealth #LoveYourLoveMuscle #Meditation #Mindfulness #Visualisation #Imagination #VeroWellness #TMGcommunity
Myanmar #earthquake wave #visualisation by European seismic detectors.
m.youtube.com- YouTubeEnjoy the videos and music you love, upload original content, and share it all with friends, family, and the world on YouTube.


The self promotion continues - Voting is open for the DH Awards 2024, and "Lines of Flight" is in the category of "Best Use of DH for Fun". If you have played or enjoyed Lines of Flight, I'd love for you to give it a vote!
Continued thread

#NeuroScience #EEG #LSL #Spectrum #FrequencyBands #Visualisation #Samadhi
Samadhi EEG 2025.2 Release
• User changeable colours and frequencies in Dancing Dots display.
• Fixed black screen error on Windows devices.
• Dedicated executables (no installation necessary) for Linux and Windows
Download: https://github.com/jkanev/samadhi/releases/tag/2025.2
Project page: http://samadhi-eeg.info
Source code: https://github.com/jkanev/samadhi