Continued thread

Hmm, I suspect people in Salisbury, MD would just skip all the steps and use the blast freezer

Hmm, I suspect people in Salisbury, MD would just skip all the steps and use the blast freezer
I have no idea what this is, but if you ever needed a flow chart on how to make Salisbury steak, LOL
My #HappyHopper (#frogger inspired) #penAndPaper game rules as a fun #minizine with an optional #flowchart you can print as the back/inside of the minizine to be seen when unfolded
You need to print with "no margins" and fold in the classic "minizine no-staple" fold you can find on youtube, articles, etc
#svg #png #text etc on archive_org: https://archive.org/details/happy-hopper-pen-and-paper-frogger
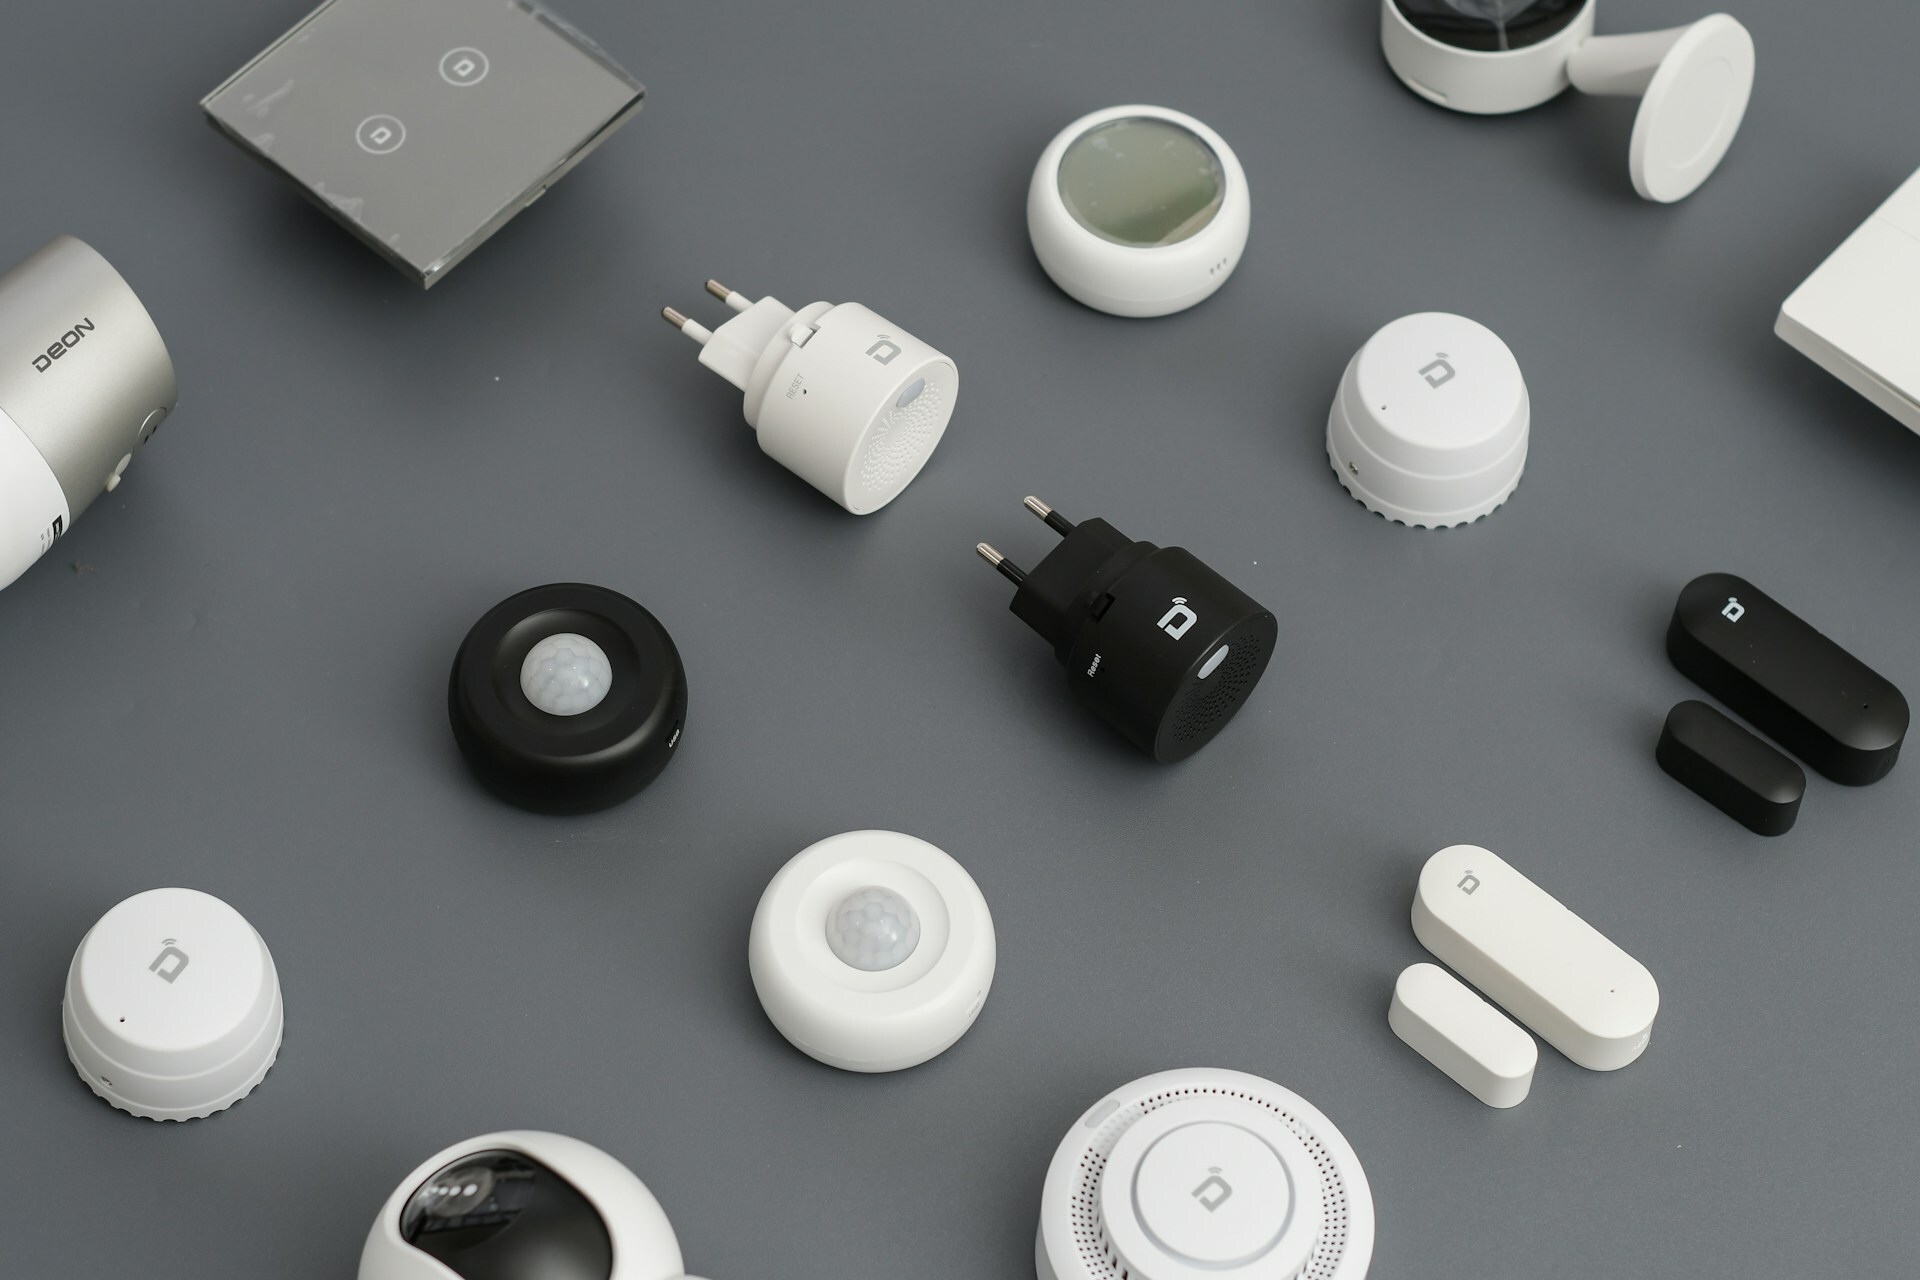
Nachdem ich nun endlich mal angefangen habe, mich in #HomeAssistant einzuarbeiten, würde ich gerne auch den #Energieverbrauch einiger Geräte gesondert erfassen, damit ich für "Zuhause" nicht nur "Nicht erfasster Verbrauch" bekomme.
Die #Wallbox #Tinkerforge #Warp3 wird die Werte, nachdem ich sie in Home Assistent integriert habe, sicher liefern.
Bei #Geschirrspüler, #Waschmaschine, #Trockner, #Warmwasserwärmepumpe brauche ich ein #Energiemessgerät für die #Steckdose, die ich ins #WLAN einbinden kann.
Hier https://cybertalk.io/de/die-besten-steckdosen-fuer-homeassistant-mit-verbrauchsmessung/#WLAN-Steckdosen wurd die #TPLink #Tapo 110 als für Home Assistant gut geeignet empfohlen. Die bekommt man für ~ 7,50 Euro, was imho absolut ok ist.
Kann ich die bedenkenlos nehmen?
Bleibt nur zu hoffen, dass das WLAN in der Waschküche gut genug ist. Das ist der einzige Raum ohne LAN-Buchse, über die man einen #Accesspoint in den Raum bringen könnte.
Wie bekomme ich die Energiedaten der 17 Jahre alten #Wärmepumpe ohne #Kommunikationsschnittstelle / #API angebunden? Vermutlich brauche ich dafür ein #Zangenenergiemessgerät 
Hat da auch jemand einen Tipp?
#HA #SmartHome #Energiewende #regenerativeEnergien #erneuerbareEnergien #Monitoring #Statistik #Statistiken #Diagramm #Diagramme #Chart #Charts #Flowchart
Nachdem seit Donnerstag endlich unser #Energiespeicher installiert ist, habe ich mich nun auch mit #HomeAssistant beschäftigt - und bin sehr begeistert, wie viele Werte und Statistiken man damit schon nach kurzer Einarbeitungszeit rausholen kann - und was Homeassistant alles kann.
Da ärgere ich mich fast, dass ich das so lange nur auf der Todo-Liste hatte 
Allerdings verstehe ich noch nicht alle Werte / Entities des #Goodwe #Wechselrichter, was die angeben bzw. worin der Unterschied liegt.
Bsp: "Meter Active Power Total" und "Active Power".
Das ist vom Wert her nicht dasselbe, ich verstehe aber noch nicht, was der Unterschied ist.
Meine #Wallbox #Tinkerforge #Warp3 bekomme ich leider noch gar nicht in Home Assistent und habe dazu noch keine Info / Anleitung gefunden. Ich bin aber 100% sicher, dass die sich in Home Assistent integrieren lässt. Da muss ich vielleicht mal bei Tinkerforge anfragen.
Was die Konfiguration von Home Assistent betrifft, habe ich auch noch ein paar Baustellen. Ich würde z.B. die Bezeichnungen und Farben von "energy-distribution" (in angehängtem Bild 1 das untere Diagramm) gern anpassen wie beim #HACS #Addon #PowerFlowCardPlus. Ich kapiere aber noch nicht, was ich dazu im #CodeEditor angeben muss.
#HA #SmartHome #Energiewende #regenerativeEnergien #erneuerbareEnergien #Monitoring #Statistik #Statistiken #Diagramm #Diagramme #Chart #Charts #Flowchart
Good but simple drawing/sketching app if you want to create a drawing quickly and easily. Drawings can be downloaded and opened again. No login.

This is in my top 100 internet content of all time list -- what a great collection of totally insane nonsense.
https://medium.com/message/amazing-military-infographics-1ba60bdc32e7

Hey Fedi,
Is anyone out there good at creating info-graphics?
I have this idea of a big, complex flowchart/info-graphic in my head that I really want to see realized, but not just as words and lines, but with nice depictions of the elements and actors.
Anybody think they can help me with that?
Ah, yet another groundbreaking innovation: a #flowchart #tool that lets you... wait for it... add nodes and move them around! 
 Because apparently, all the previous flowchart tools were just too complicated with their "features" and "options."
https://www.flow.diy #innovation #techhumor #simplicity #userfriendly #HackerNews #ngated
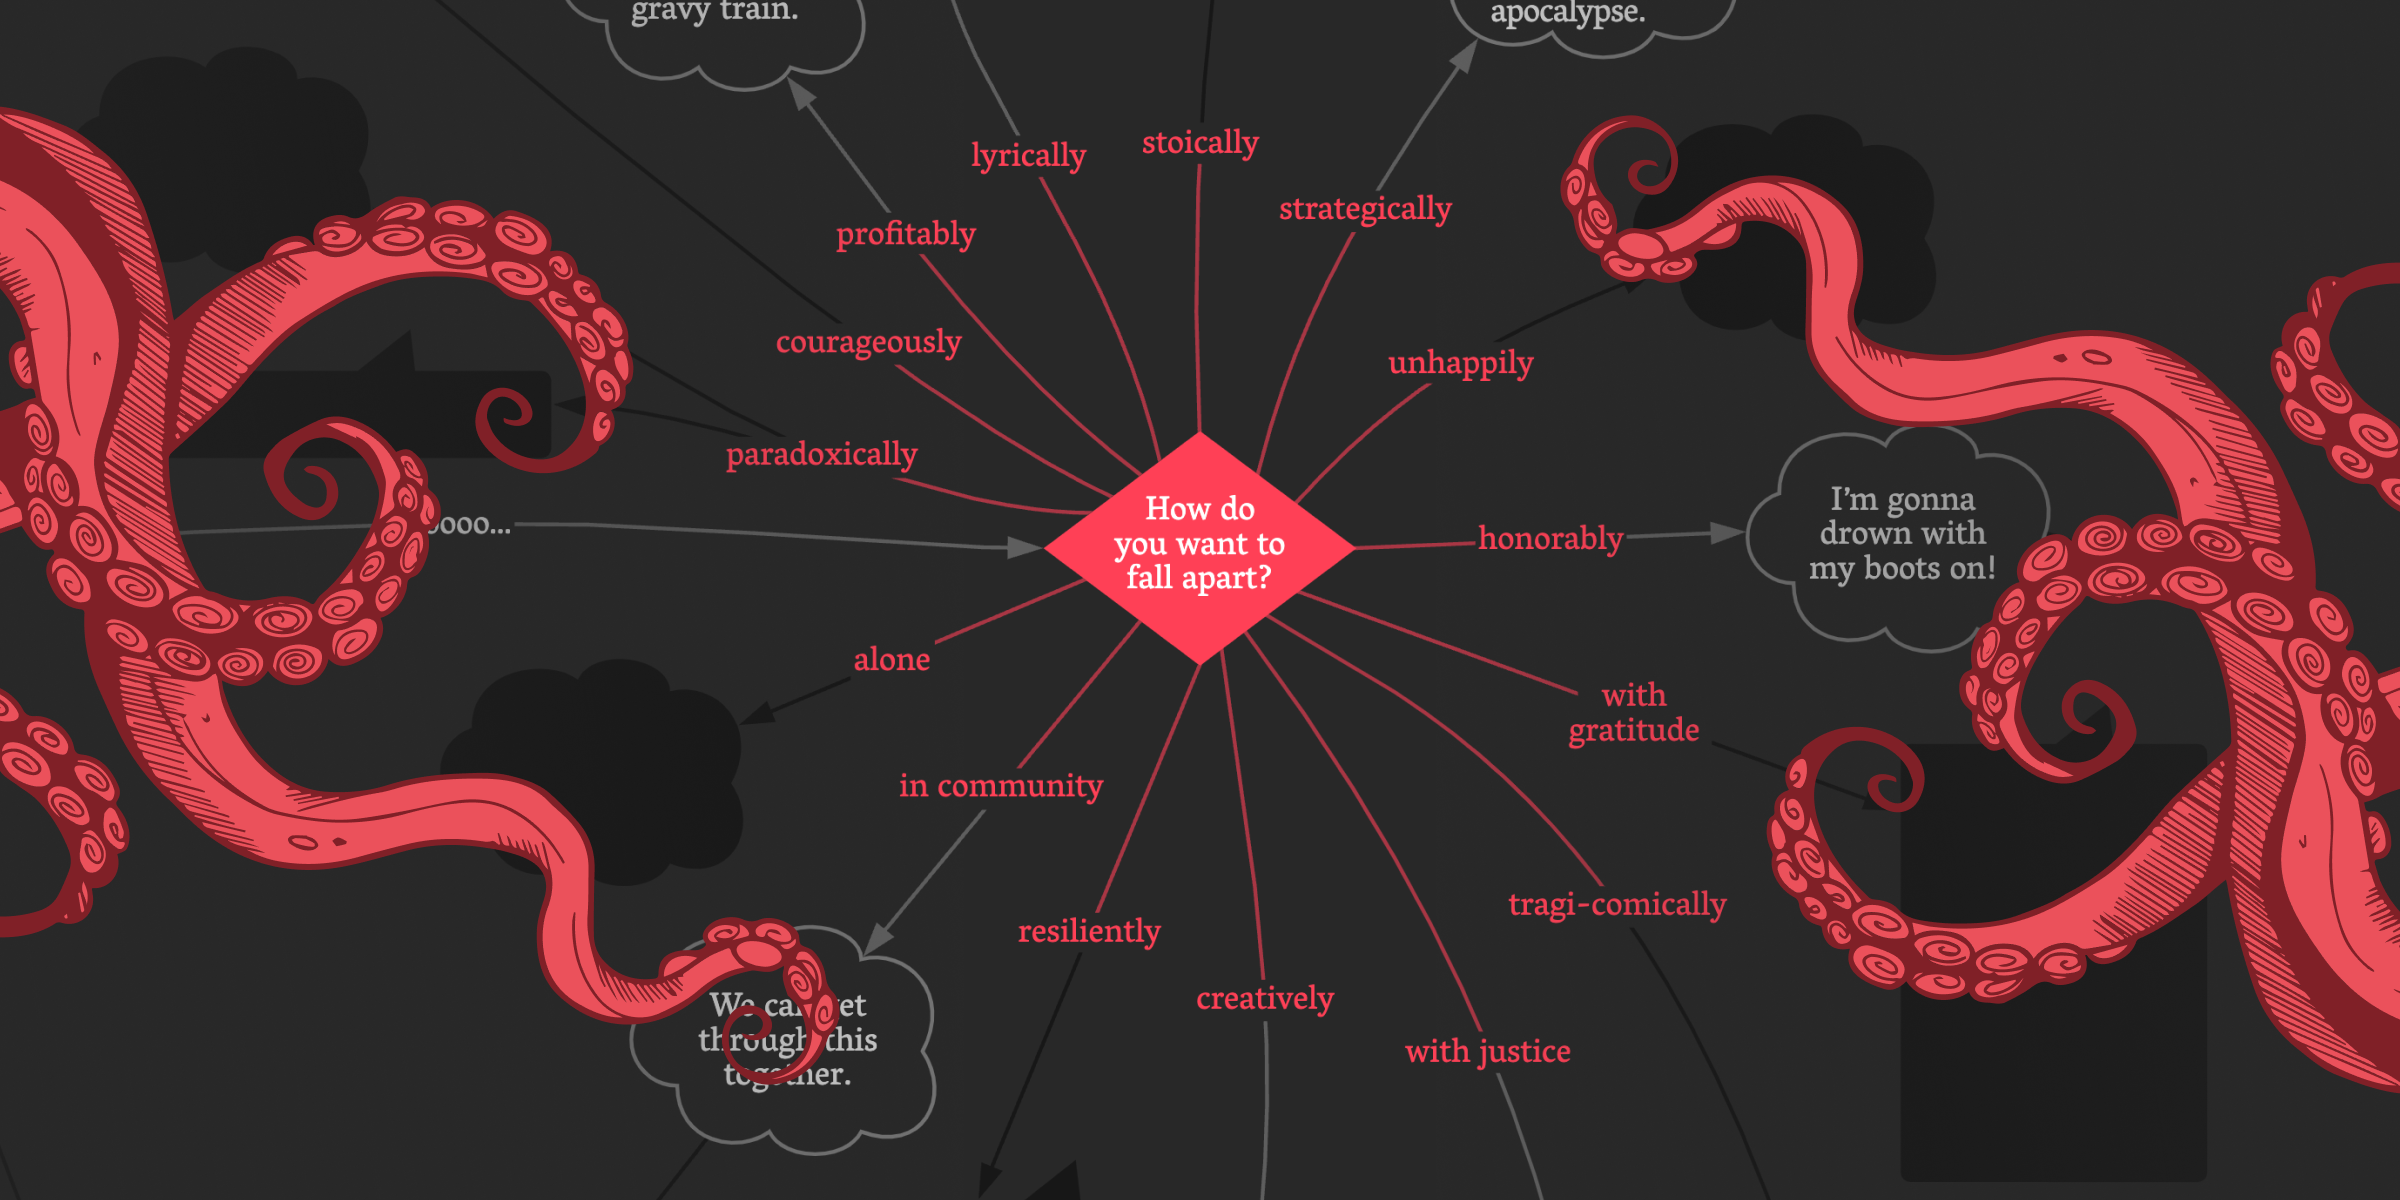
 »I Want a Better Catastrophe« made it onto the short list of the Information is Beautiful Awards in the “Places, Spaces & Environment” category.
The flowchart by @jona combines audio narration with interactive elements as an invitation to join #AndrewBoyd on his narrative path and explore our predicament on your own: https://flowchart.bettercatastrophe.com
You can find all other short-listed entries here: https://www.informationisbeautifulawards.com/showcase?action=index&award=2024&controller=showcase&page=1&pcategory=short-list&type=awards
[Veille data] une chouette série de « logigrammes interactifs : questions juridiques et éthiques liées à mon projet de recherche » sur DoraNUM doi:10.13143/DVFD-3F98 
https://doranum.fr/aspects-juridiques-ethiques/logigrammes-interactifs-questions-juridiques-et-ethiques-liees-a-mon-projet-de-recherche_10_13143_dvfd-3f98/
#openscience #researchdata #privacy #rgpd #donnéessensibles #donnéespersonnelles #logigramme #flowchart
Does YOUR project need #Kubernetes?
#InkscapeAbenteuer
#Objektverbinder greifen leider nur zum #Schwerpunkt des Objekts, nicht zu gesetzten Knoten am Rand, man ist also auf einen Verbinder pro Paar beschränkt: #Flowchart only. 
Faserpaare, mehrere Anschlüsse an der Komponente, etc. lassen sich so nicht verschiebungsfreundlich darstellen. (Dafür wären Verbinder, die man an gesetzte Objektknoten andocken kann, erforderlich). Das wäre mal ein #Featurerequest 
Nachträgliche Umbauten eintragen ist ohne so zeitaufwendig.
Das interaktive Flowchart zur Klimakrise von Andrew Boyd ist nun auf Deutsch verfügbar: https://flowchart.bettercatastrophe.com/de/
Übersetzt wurde das Flowchart im Rahmen der Buchveröffentlichung »Klima, Kollaps, Kommunikation – Perspektiven auf das Climate Endgame«: https://klima-kollaps-kommunikation.de

Hi, any #MediaWiki experts here? I am trying to find out whether it is possible to create some sort of interactible / collapsible #flowchart /#mindmap /#diagram to be used from the wiki. I do not need editor within the wiki, just to use them. PS: it is internal-only company wiki
Мені не можна знаходити в інтернет, бо він відволікає
ось json Canvas, можна гратись до несхочу
Сайт: https://jsoncanvas.org/docs/apps/
Приклади веб-застосунків:
- kinopio.club — https://kinopio.club/hello-kinopio-JbT9dl4fxg7WlNdjMXEsf
- flowchart.fun — https://flowchart.fun
- hi-canvas — https://hi-canvas.marknoteapp.com/editor/1732802823259
- OrgPad — https://orgpad.info
#JsonCanvas #kinopio #flowchart #hi-canvas #OrgPad #застосунки #продуктивність

What if each node in your hybrid mindmap/flowchart could be a whole document? Including interactive tasks? And with the ability for each node to include another document off canvas?
And all with automatic layout? Try it out in QuikFlow 1.7!
Every time I use tldraw, I’m amazed anew how excellent it is. If you ever need a case study for Just Works™…