Identification Of Geothermal Anomalies From Landsat Derived Land Surface Temperature, Mount Meager Volcanic Complex, British Columbia, Canada
--
https://doi.org/10.1016/j.rse.2025.114649 <-- shared paper
--
“Highlights:
• A novel method for detecting geothermal components from solar energy dominated LST.
• Using LST time series to eliminate temporal variant solar energy input.
• Uncertainty in anomaly identification quantified by probability measure.
• Capable of revealing LST anomalies caused by geothermal, anthropogenic and surface processes..."
#GIS #spatial #mapping #britishcolumbia #BC #solar #geothermal #remotesensing #earthobservation #LST #spatialanalysis #spatiotemporal #naturalresources #volcanic #geology #geostatistics #landsurfacetemperature #satellite #geothermalheatflux #GHF #energybalance #calculation #model #MountMeager #Landsat #landsat8 #hotspring #landslide #massmovement #engineeringgeology #spring #seep #anthropogenic #HEP #hydropower #monitoring #risk #hazard
Recent searches
Search options
#geostatistics
A Methodology For The Multitemporal Analysis Of Land Cover Changes And Urban Expansion Using Synthetic Aperture Radar (SAR) Imagery - A Case Study Of The Aburrá Valley In Colombia
--
https://doi.org/10.3390/rs17030554 <-- shared paper
--
#GIS #spatial #mapping #SyntheticApertureRadar #SAR #remotesensing #multitemporalanalysis #landcover #landcoverchange #clustering #kurtosis #fuzzylogic #kernelbasedmethod #machinelearning #spatialanalysis #spatiotemporal #geostatistics #model #modeling #AburráValley #Columbia #urban #urbanexpansion #population #growth #topography #monitoring #satellite #sentinel #valley #landuse #distribution #infrastructure #building #roads #naturalresources #environmental #conservation #monitoring #multitemporal
Grfin Tools—User Guide And Methods For Modeling Landslide Runout And Debris-Flow Growth And Inundation
--
https://pubs.usgs.gov/publication/tm14A3 <-- shared USGS publication
--
https://code.usgs.gov/grfintools/grfintools <-- shared USGS software release
--
H/T Jonathan Perkins USGS
[ another open source resource for everyone from the USGS ~smile~ ]
#GIS #spatial #mapping #opensource #openlibrary #Grfin #software #package #regional #debrisflow #engineeringgeology #geology #inundation #spatialanalysis #spatiotemporal #geophysics #geophysical #massmovement #landslide #lahar #volcano #rock #avalanche #model #modeling #statistical #geostatistics #water #hydrology #downstream #elevation #remotesensing #DEM #flow #runout #risk #hazard #tools #slope #erosion #drainage #network #channel #channelisation #userguide
@USGS
QGIS Processing Toolbox tool for Variogram Modeling and Ordinary Kriging using GSTools
This tool automates variogram modeling and kriging within QGIS, providing a user-friendly interface for spatial interpolation.
#qgis #geostatistics #kriging #prediction #variogram #python #gstools #gstat
https://github.com/geosaber/geostat

PyForestScan - A Python Library For Calculating Forest Structural Metrics From LiDAR Point Cloud Data
--
https://doi.org/10.21105/joss.07314 <-- shared paper
--
https://github.com/iosefa/PyForestScan <-- GitHub repository
--
[disclaimer: I have not tried this library]
#GIS #spatial #mapping #JOSS #remotesensing #LiDAR #pointcloud #forest #structural #metrics #spatialanalysis #geostatistics #ecology #ecological #FHD #PAD #PyForestScan #model #modeling #opensource #Python #library #density #canopyheight #areaindex #DTM #output #PDAL #forest #forestry #monitoring #carbonaccounting
[USGS] Geologic Hydrogen Prospectivity Map Explorer
--
https://www.usgs.gov/index.php/tools/geologic-hydrogen-prospectivity-map-explorer <-- shared technical resource
--
https://doi.org/10.3133/pp1900 <-- shared USGS publication
--
https://certmapper.cr.usgs.gov/data/apps/hydrogen/ <-- link to web map
--
#GIS #spatial #mapping #remotesensing #geology #geophysics #geophysical #magnetics #gravity #gravimetric #hydrogen #geologichydrogen #fuel #fuelsource #prospecting #spatialanalysis #USA #prospectivity #webmap #CONUS #naturalhydrogen #hydrogengas #cleanfuels #fossilsfuels #climatechange #serpentinization #radiolysis #geologicprocesses #geostatistics
@USGS
Dream Jobs Around The World - The Careers People Are Searching For The Most
--
https://www.remitly.com/gb/en/landing/dream-jobs-around-the-world <-- shared article
--
[I do like the New Zealanders want to be DJs :) ‘Influencer’ is – thankfully – only hinted at, NOT being a real job, just glorified begging…]“
#GIS #spatial #mapping #FridayFeeling #FridayFun #jobs #careers #global #immigration #emigration #roles #professions #newjob #GoogleSearch #geostatistics #global
there are a couple of hours left to submit a #geostatistics
abstract to #EGU25
:-)
looking forward to your contribution!
We would encourage you to submit an #EGU25 #EGU2025
abstract related to #geostatistics to the session
"Advanced Geostatistical Methods and Uncertainty Analysis in Hydrological and Environmental Sciences"
https://meetingorganizer.copernicus.org/EGU25/session/52667
Looking forward to meeting you in Vienna!
An Examination Of GNSS Positioning Under Dense Conifer Forest Canopy In The Pacific Northwest, USA
--
https://doi.org/10.1016/j.rsase.2024.101428 <-- shared paper
--
#GIS #spatial #mapping #ForestMonitoring #continuousforestinventory #CFI #remotesensing #GNSS #accuracy #positioning #forest #trees #surveygrade #height #resouce #resourcemanagement #Washington #WashingtonState #WA #PNW #PacificNorthwest #canopy #conifer #GPS #postprocessing #estimation #technology #geostatistics #model #modeling #spatialanalysis #corrleation
#TeamTales No. 35: Jonathan Frank is a PhD candidate in the GIScience group of Prof. Alexander Brenning at @unijena
He works on nationwide recognition of groundwater trade pollution using geostatistics, with AI & ML.
Linking Inca Terraces With Landslide Occurrence In The Ticsani Valley, Peru
--
https://doi.org/10.3390/geosciences14110315 <-- shared paper
--
[takes me back to my engineering geology days in the Southern Hemisphere, including my thesis – with a healthy dose of spatial analysis and modeling – and all with a specific use; what is not to like?]
#GIS #spatial #mapping #landslides #massmovement #Inca #Andes #irrigation #terraces #Peru #SouthAmerica #confusionmatrix #logisticregression #geohazards #spatialanalysis #spatiotemporal #terracing #water #hydrology #surfaceflow #geomechanical #geotechnical #Ticsani #algorithm #processes #geostatistics #river #slope #agriculture #farming #soils #geology #risk #hazard #publicsafety #fem #model #modeling #rainfall #precipitation #permeability #groundwater #subsurfaceflow #instability #fluvial #erosion
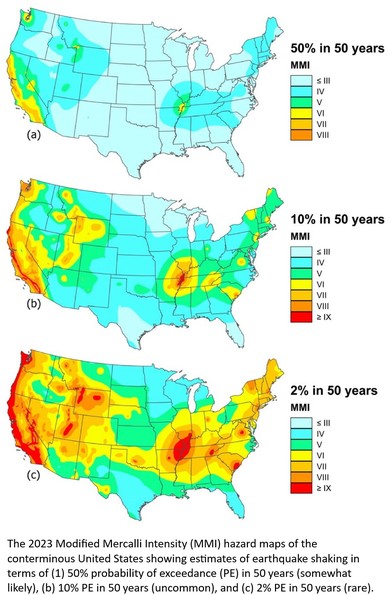
The 2023 US 50-State National Seismic Hazard Model - Overview And Implications
--
https://www.usgs.gov/programs/earthquake-hazards/science/2023-national-seismic-hazard-model-whats-shaking <-- USGS technical article
--
https://doi.org/10.1177/87552930231215428 <-- shared paper
--
#GIS #spatial #mapping #earthquake #seismichazard #risk #hazard #shakemap #cost #economics #geology #engineeringgeology #hazardmodel #model #modeling #seismicity #faultruptures #groundmotions #probabilistic #probability #geostatistics #engineering #planning #management #mitigation #NSHM #forecast #infrastructure #publicsafety #hazardassessment #fault #faulting #structuralgeology #intensity #mercalli #buildingcode #design #publicpolicy #shakemap #engineeringrisk #future
@USGS @FEMA
MarineTraffic – Web Map Of Global Shipping
--
https://www.marinetraffic.com/en/ais/home/shipid:381733/zoom:10 <-- shared live web map example
--
https://youtu.be/1QJknKiP9_Y?si=cjHHA-SmWXWs8bqQ <-- introductory video
--
[sharing of this website/service does not constitute an endorsement]
#GIS #spatial #mapping #webmap #spatialanalysis #global #MarineTraffic #shipping #telecommunications #research #vessel #movement #tracking #safety #navigation #incidents #critical #risk #hazard #mitigation #planning #marine #ocean #informationsystems #geostatistics #statistics #ports #pollution #routing #weather #metrology #piracy #protection #cargo #trade #internationaltrade
A new R package for calculating the statistics of overlaps of spatial boundaries:
https://www.biorxiv.org/content/10.1101/2024.10.20.619279v1

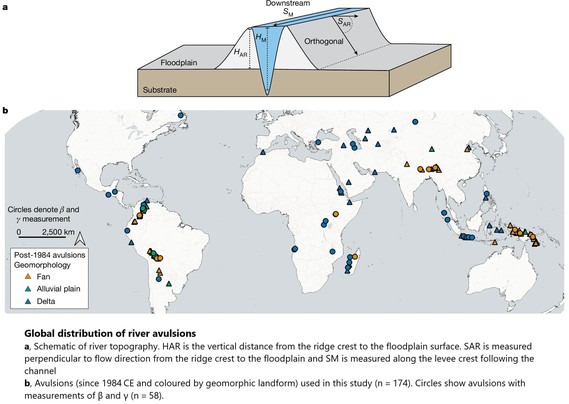
Rules Of River Avulsion Change Downstream
--
https://doi.org/10.1038/s41586-024-07964-2 <-- shared paper
--
#GIS #spatial #mapping #river #water #hydrology #avulsion #geomorphology #geomorphometry #floodplain #flood #flooding #course #risk #hazard #elevation #topography #hydromorphic #hydrospatial #model #modeling #factors #coast #coastal #mountain #fan #riskassessment #global #spatialanalysis #management #mitigation #prediction #remotesensing #ICESat2 #FABDEM #Copernicus #algorithm #fluvial #alluvial #sediment #alluvium #sediment #machinelearning #graphdata #geostatistics #spatiotemporal
Strong Regional Trends In Extreme Weather Over The Next Two Decades Under High- And Low-Emissions Pathways
--
https://www.nature.com/articles/s41561-024-01511-4 <-- shared technical article
--
#GIS #spatial #mapping #spatialanalysis #spatiotemporal #climatechange #globalwarming #climate #extremeweather #global #regions #ratesofchange #risk #hazard #prediction #model #modeling #numericalmodeling #simulation #geostatistics #climatemodel #tropics #subtropics #emmissions #temperature #precipitation #water #rainfall #hydrology #flood #flooding #wildfire #fire #drought #storms #monsoon #typhons #hurricanes #Asia #Africa
Global Groundwater Depletion Is Accelerating But Is Not Inevitable, Say Researchers
--
https://phys.org/news/2024-01-global-groundwater-depletion-inevitable.html <-- shared technical article
--
https://youtu.be/Hv5tlyKEoXU?si=sovXv2kSQFdN3AtO <-- shared paper
--
#GIS #spatial #mapping #water #hydrology #groundwater #waterresources #watermanagement #management #global #depletion #pumping #overpumping #model #modeling #spatialanalysis #spatiotemporal #waterlevel #literaturesearch #database #records #aquifer #subsurface #climatechange #subsidence #arid #farming #agriculture #irrigation #wateruse #watersecurity #historicaldata #statistics #geostatistics
Scientists Uncover Hidden Forces Causing Continents To Rise
--
https://www.southampton.ac.uk/news/2024/08/scientists-uncover-hidden-forces-causing-continents-to-rise.page <-- shared technical article
--
https://doi.org/10.1038/s41586-024-07717-1 <-- shared paper
--
https://doi.org/10.1038/s41586-023-06193-3 <-- shared related, previous paper
--
#geology #model #modeling #structuralgeology #uplift #escarpments #Africa #Brazil #tectonics #tectonicplates #plateaus #GreatEscarpment #SouthAfrica #continents #rifts #plateboundaries #mantle #upwelling #geomorphology #cratons #uplift #geostatistics #statistics #spatiotemporal #spatialanalysis #numericmodeling #computermodeling
On The Uncertain Intensity Estimate Of The 1859 Carrington Storm
--
https://doi.org/10.1051/swsc/2024015 <-- shared paper
--
https://en.wikipedia.org/wiki/Carrington_Event <-- background on the Carrington Event
--
["The big one", if it happened today we would be right royally %^#$& (excuse my pretend language ), we are nowhere close to being hardened, etc; my other ½ is a space weather scientist, until I knew her I was not fully aware of all the risks and hazards associated with space weather]
#GIS #spatial #mapping #Magneticstorm #spaceweather #historicalevent #statisticalanalysis #spatialanalysis #geostatistics #model #modeling #geomagneticstorm #geomagnetism #solar #sun #risk #hazard #infrastructure #CME #coronalmassejection #solarflare #blackouts #humanimpacts #electricpowergrid #CarringtonEvent #numericmodel #aurora #usgs #space #geophysics #naturalhazards #extremeevents


![Map showing concentrations of geologic hydrogen greater than 0.5 mole percent as reported in drill-well gas samples throughout the conterminous United States (data from U.S. Geological Survey [2019], Zgonnik [2020], and Brennan and others [2021]). Symbol size correlates with concentration. Labeled concentrations are rounded to the nearest integer value. Map showing concentrations of geologic hydrogen greater than 0.5 mole percent as reported in drill-well gas samples throughout the conterminous United States (data from U.S. Geological Survey [2019], Zgonnik [2020], and Brennan and others [2021]). Symbol size correlates with concentration. Labeled concentrations are rounded to the nearest integer value.](https://files.techhub.social/media_attachments/files/113/879/707/233/959/555/small/ab34093c1cb42622.jpg)


![Photos taken horizontally and vertically from the interior of the study area [of trees and undergrowth] Photos taken horizontally and vertically from the interior of the study area [of trees and undergrowth]](https://files.techhub.social/media_attachments/files/113/671/348/862/639/211/small/78accba6c6f9dbce.jpg)


![imagery / map / schematic cross-section - (A) A 3D view of the San Cristobal landslide. (B) A 1:50,000 geological map of the landslide area, modified from [33]. Ki-mat = Matalaque Fm. P-Pi = Puno Fm. Q-pl = colluvial deposits, debris avalanche. Qp-vl-pi = pyroclastic deposits. Red line marks the topographic cross-section shown in A. (C) Cross-section of the San Cristobal landslide with estimated base groundwater conditions (blue) and materials boundaries (green) to be used for modeling and interpreted potential failure surfaces (dashed red). imagery / map / schematic cross-section - (A) A 3D view of the San Cristobal landslide. (B) A 1:50,000 geological map of the landslide area, modified from [33]. Ki-mat = Matalaque Fm. P-Pi = Puno Fm. Q-pl = colluvial deposits, debris avalanche. Qp-vl-pi = pyroclastic deposits. Red line marks the topographic cross-section shown in A. (C) Cross-section of the San Cristobal landslide with estimated base groundwater conditions (blue) and materials boundaries (green) to be used for modeling and interpreted potential failure surfaces (dashed red).](https://files.techhub.social/media_attachments/files/113/529/353/200/651/116/small/4c7094bbcfb5f7b1.jpg)


![maps - [global] Spatial patterns of near-term joint rates of change in extremes, and their components maps - [global] Spatial patterns of near-term joint rates of change in extremes, and their components](https://files.techhub.social/media_attachments/files/113/166/729/491/853/876/small/5db65342178c8ad8.jpg)


